Since I am hosting couple of sites, including this one, on my own hardware, I was interested in seeing what kind of traffic my sites are getting. Currently my stack looks like this:
- Domain (viljami.it) pointed to my public IP via Cloudflare Proxy
- Public IP port 443 forwarded to NGINX Proxy Manager Docker container
- Traffic forwarded to separate NGINX dockers by request domain
- NGINX Proxy Manager logs parsed by GoAccess container. This was pretty crude implementation as it only parses the logs at container startup and does not update automatically.
—
This is where the process previously stopped and 4. is now replaced by: - Filebeat container ingests NGINX Proxy Manager logs and feeds them to Elasticsearch container
- Kibana container allows me to browse and analyze the logs in a flexible UI
Main problems I encountered and resolved
- Elasticsearch image for Unraid had missing fields
- Kibana image for Unraid had missing fields
- Filebeat didn’t have Unraid image at all in Community Applications
- This may have been an user issue but I couldn’t get the docker.elastic.co/beats/filebeat:7.17.9 image to authenticate with ES but elastic/filebeat:7.17.9 did with the same config path and permissions.
- ES, Kibana and Filebeat versions must all match. I deployed the latest ES 7 so 7.17.9
- For some reason I couldn’t get ES 8 to work at all on my system
- Their docker images do not support the :latest tag and you must specify the version to pull
- By default NGINX Proxy Manager uses non-standard log format! This caused a lot of trouble with log parsing until I figured it out.
Installing and configuring the Docker containers in Unraid GUI
I cannot speak for version 8 but these steps worked for 7.17.9. Main steps are: add container, configure its variables and paths, copy its config files into the mapped path, edit the config. Here are my values for these three containers:
Repository: elasticsearch:7.17.9


Host path: /mnt/user/appdata/elasticsearch/data
Container path: /usr/share/elasticsearch/data

Host port: 9200
Container port: 9200

Host port: 9300
Container port: 9300

Host path: /mnt/user/appdata/elasticsearch/config
Container path: /usr/share/elasticsearch/config

Variables:
	Key: discovery.type
	Value: single-node

	Key: ELASTIC_PASSWORD
	Value: you have to set a password here! Later it is referenced as $ELASTIC_PASSWORD
Note that in order to Elasticsearch to run, you have to add this script to User Scripts and run it!
#!/bin/bash
sysctl -w vm.max_map_count=262144
Source and more info: https://forums.unraid.net/topic/79125-support-foxxmd-elasticsearch/
Repository: kibana:7.17.9

Variable:
	Key: ELASTICSEARCH_HOSTS
	Value: http://ES server IP:9200

Host path: /mnt/user/appdata/kibana
Container path: /usr/share/kibana/config

Host port: 5601
Container port: 5601
Repository: elastic/filebeat:7.17.9
Host path: /mnt/user/appdata/filebeat/config
Container path: /usr/share/filebeat
Host path: /mnt/user/appdata/NginxProxyManager/log/
Container path: /var/log/nginx
Once the containers are (hopefully) running you have to SSH to the host Unraid system and copy the container’s config files to the host system so you can edit them. It can be done using these commands:
docker cp elasticsearch:/usr/share/elasticsearch/config /mnt/user/appdata/elasticsearch
docker cp kibana:/usr/share/kibana/config /mnt/user/appdata/kibana
docker cp filebeat:/usr/share/filebeat /mnt/user/appdata/filebeat/config

I also noticed that Filebeat required me to restore its permissions in order to start again.
You can do it using:
chown -R 1000:1000 /mnt/user/appdata/filebeat
From here on you should be able to follow generic Elasticsearch 7 guides and the official docs: https://www.elastic.co/guide/en/elasticsearch/reference/7.17/getting-started.html
https://www.elastic.co/guide/en/beats/filebeat/7.17/filebeat-installation-configuration.html
Here are also post my own config yml’s. The first line of each code block is path of the file and not a part of the code.
/mnt/user/appdata/filebeat/config/filebeat.yml
filebeat.config:
  modules:
    path: ${path.config}/modules.d/*.yml
    reload.enabled: false

processors:
  - add_cloud_metadata: ~
  - add_docker_metadata: ~

output.elasticsearch:
  hosts: ["ES server IP:9200"]
  username: "elastic"
  password: "$ELASTIC_PASSWORD"

setup.kibana:
  host: "192.168.178.11:5601"
  username: "elastic"
  password: "$ELASTIC_PASSWORD"
/mnt/user/appdata/filebeat/config/modules.d/nginx.yml
# Module: nginx
# Docs: https://www.elastic.co/guide/en/beats/filebeat/7.17/filebeat-module-nginx.html
- module: nginx
# Access logs
access:
enabled: true
var.paths: ["/var/log/nginx/*access.log"]
# Set custom paths for the log files. If left empty,
# Filebeat will choose the paths depending on your OS.
#var.paths:
# Error logs
error:
enabled: true/mnt/user/appdata/elasticsearch/config/elasticsearch.yml
cluster.name: "docker-cluster"
network.host: 0.0.0.0
xpack.security.enabled: true
xpack.security.authc.api_key.enabled: true/mnt/user/appdata/kibana/kibana.yml
# Default Kibana configuration for docker target
server.host: "0.0.0.0"
server.shutdownTimeout: "5s"
elasticsearch.hosts: [ "http://ES server IP:9200" ]
monitoring.ui.container.elasticsearch.enabled: true
elasticsearch.username: "elastic"
elasticsearch.password: "$ELASTIC_PASSWORD"Other configuration
I am writing this up the day after setting this up myself so I might have forgot some steps and I definitely recommend checking and following the official guides. Some other mentionable steps are:
Connecting Filebeat to Kibana and generating log parse pipeline and (lots of) default dashboards:filebeat setup -e
This must be run inside the container so in my case it was done through Unraid gui and opening the container’s own terminal
All the containers use default network settings and didn’t need anything else.
Kibana interface really wanted me to try Elastic Agent instead of Filebeat but I didn’t really see the benefit and it seemed to need even more configuration with my brief testing.
NGINX Proxy Manager logs
By default NGINX Proxy Manager uses custom log format that unmodified Filebeat cannot parse. Rather than build a custom parse config I found a way for it to output standard NGINX logs: https://github.com/NginxProxyManager/nginx-proxy-manager/issues/126#issuecomment-1059785725
To quote the answer:
I changed the conf file generated by NPM for my host ( location: /data/nginx/proxy_host filename will be 1.conf or similar)
Inside it there is a line:access_log /data/logs/proxy-host-1_access.log proxy;
changed it to:access_log /data/logs/proxy-host-1_access.log;
After setting this to each host you have and/or want to log, restart the container and new log lines should have the client IP as first item of the line – a format that Filebeat expects.
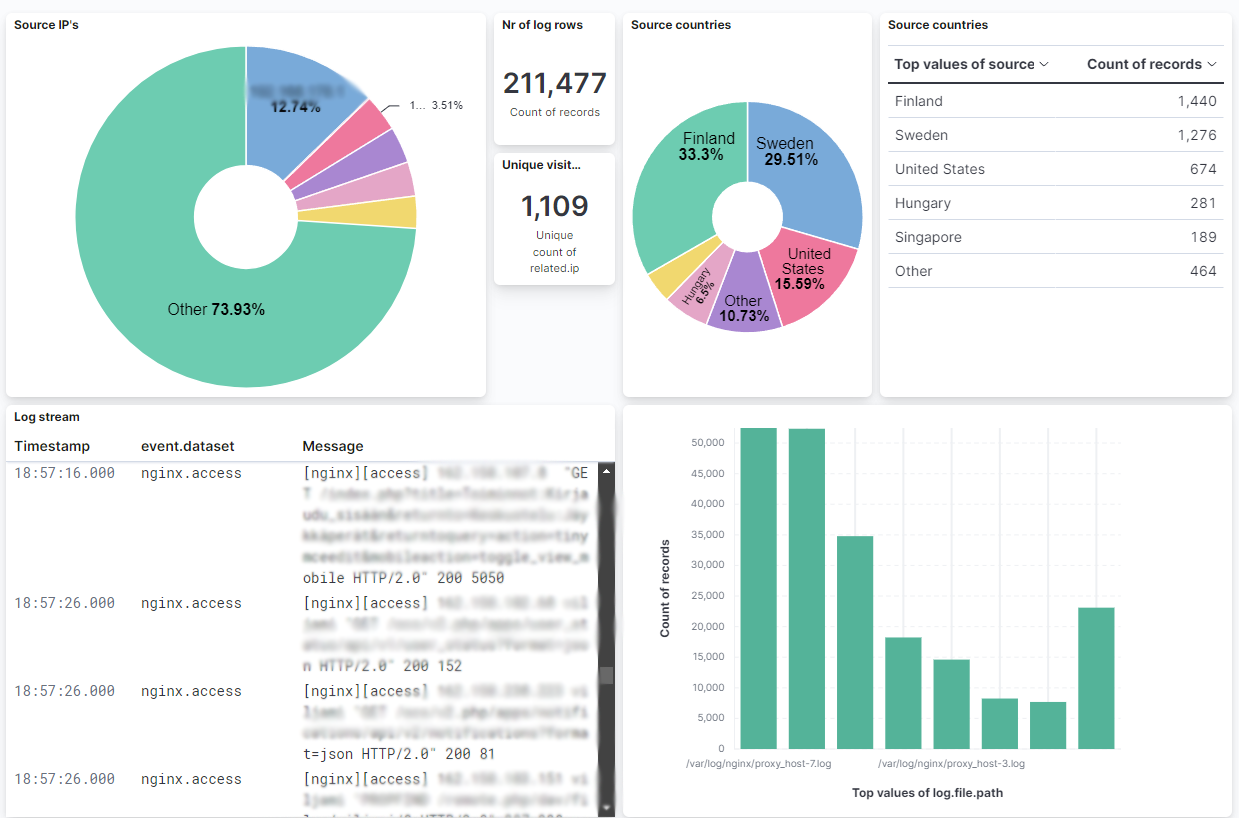
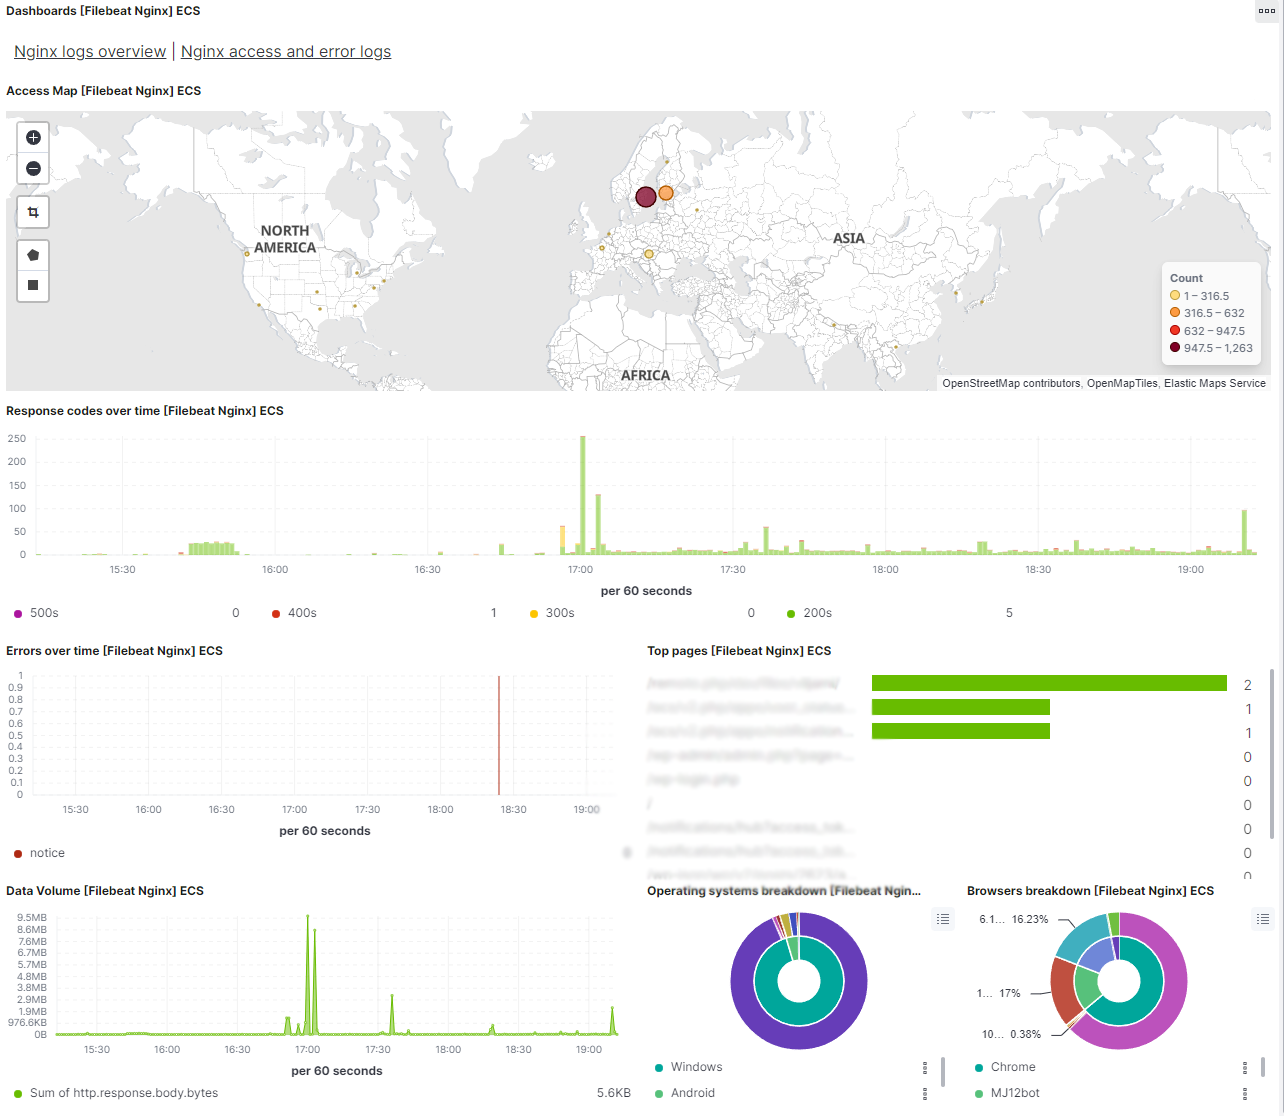
At this point, and after restarting all the containers multiple times, I was able to see new log entries in Kibana and was happy with the progress for the day.
Performance
Though I don’t have anything to really compare to, the current stack uses about 1,6 GB of ram while writing this. The usage may increase with load but at least compared to the recommended 8 GB system memory this seems very reasonable.
Probably forgot something
I’m leaving the comments open for a while since I didn’t follow the steps afterwards to make sure everything was there. Feel free to ask though I’m far from an expert with Elastic.
While writing this I remembered to do some maintenance to this blog and realized it didn’t have dark mode support. Now I enabled that and noted that some links don’t follow the color scheme but I must post this before investigating further or it will never happen😄